How steep is this path? Adding gradient data accessibly to digital maps
Originally shared on LinkedIn (opens in a new window), 2026-08-06.
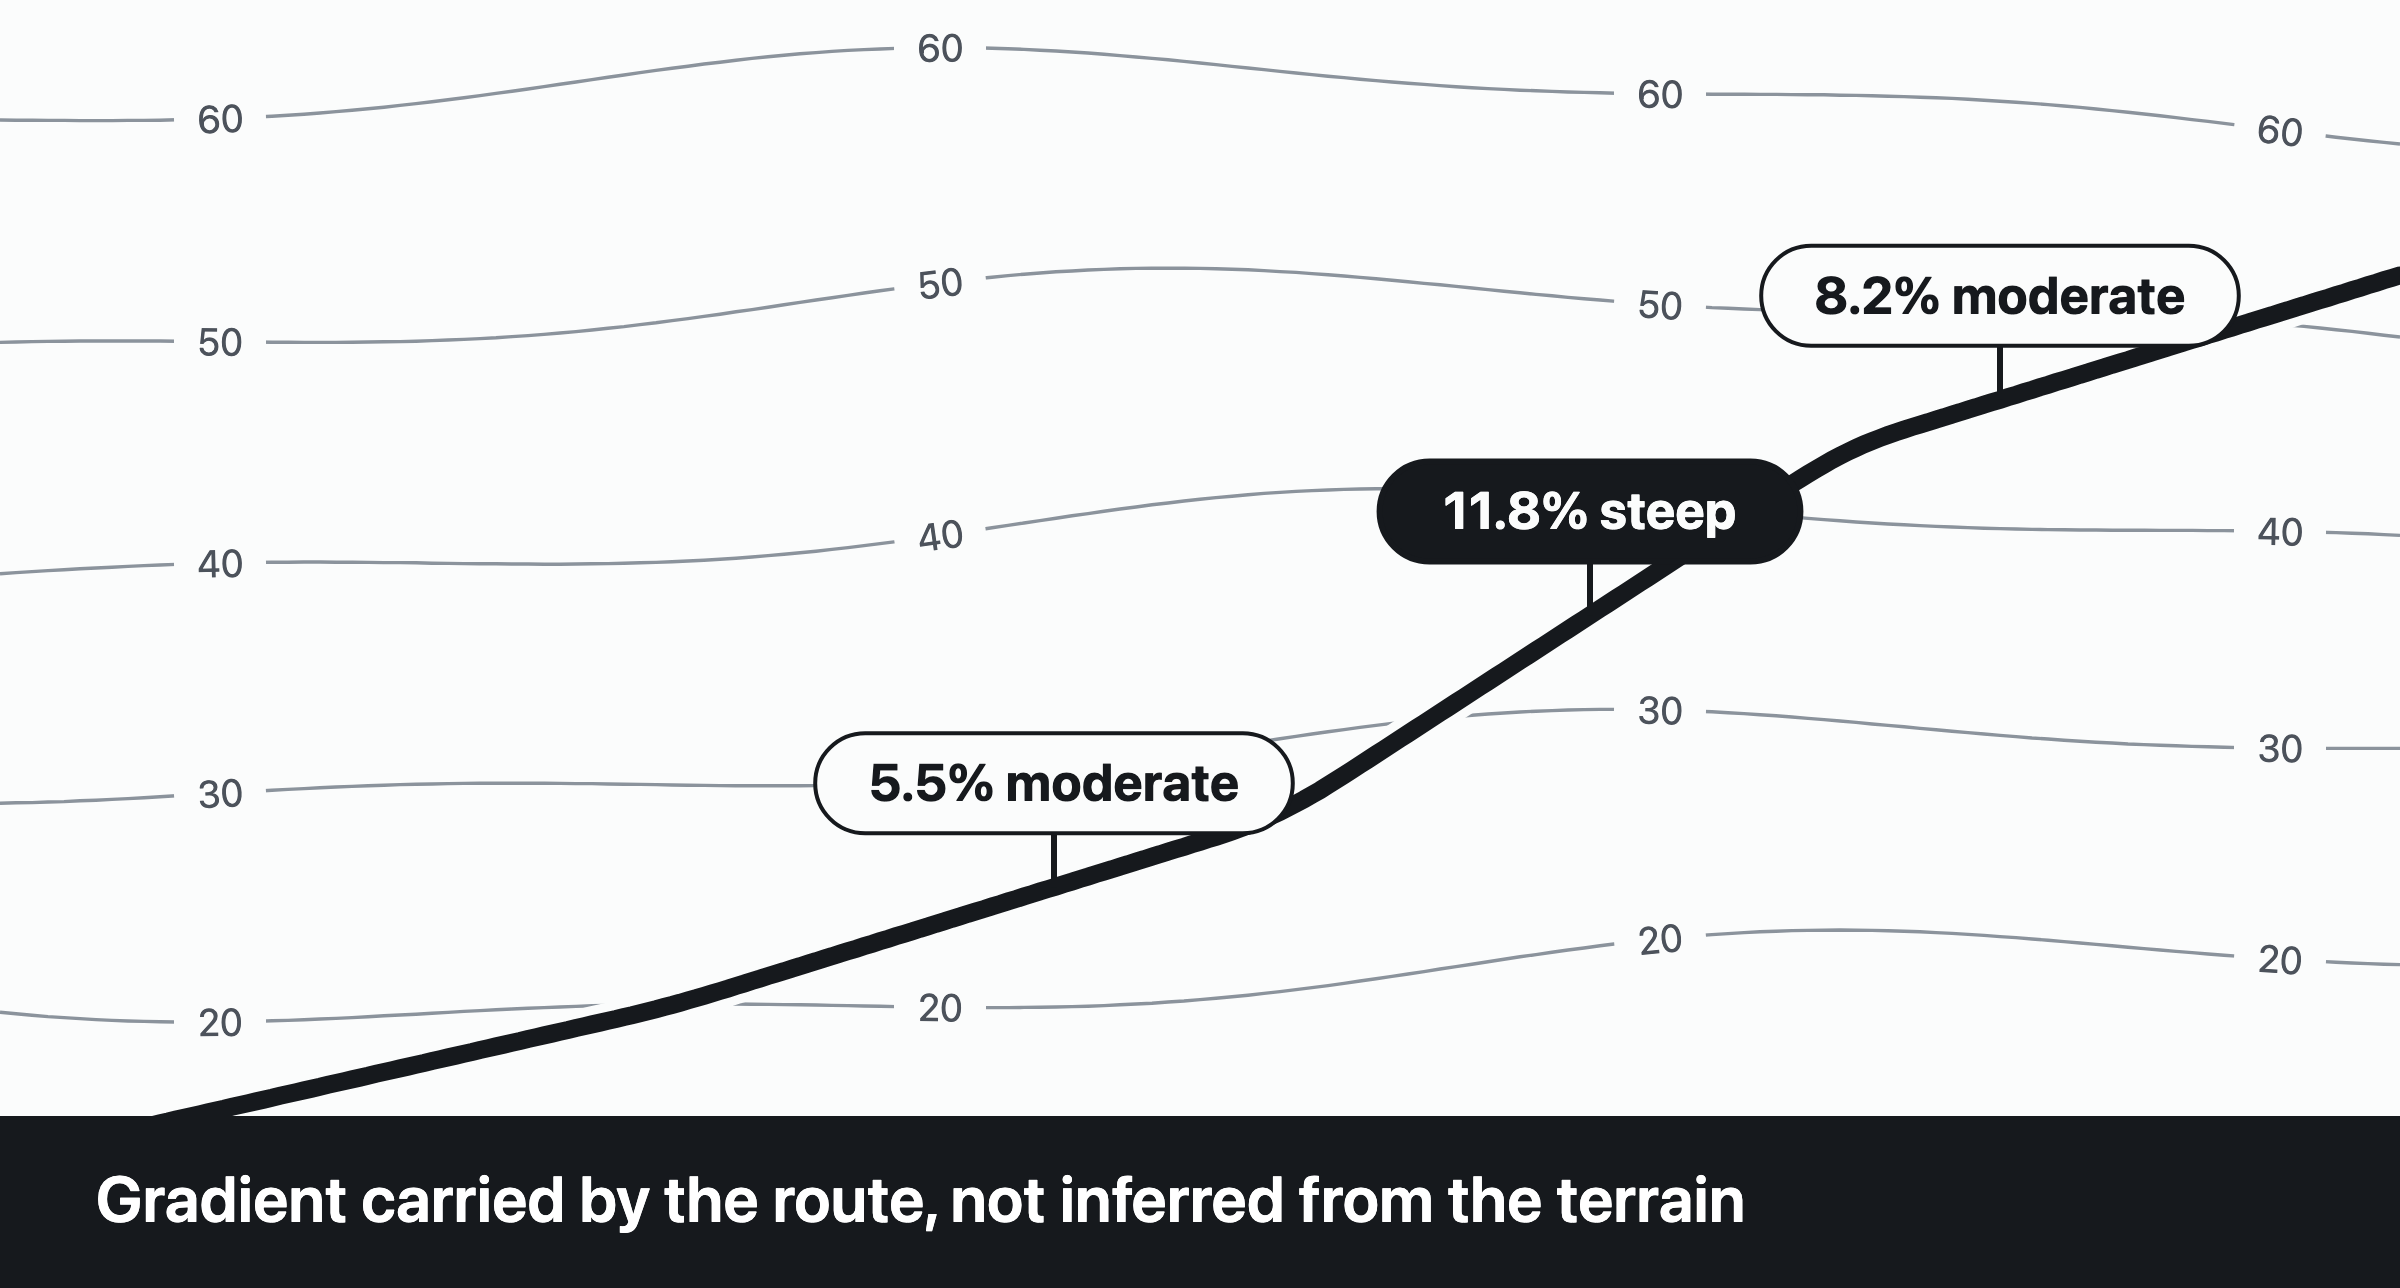
Few general purpose digital maps can answer the question of how steep a given street or path is, and for a significant part of the population that question determines whether a route exists at all. Distance and connectivity are universally published, gradient less so, even when the map data is designed to hold it.
This account describes the derivation of sustained street and path gradients from public elevation models, the accuracy and coverage problems encountered, and the limits of the resulting data. The work spans several countries with markedly different elevation provision, principally Canada, the United States, Ireland, the United Kingdom and Switzerland, and much of the difficulty arose from those differences rather than from the derivation itself. The work was carried out for an accessible mapping project I maintain, and the figures given are drawn from that project's production index.
Gradient is a threshold quantity, and the threshold is 8.33 percent
The governing figure is 8.33 percent, a slope of one in twelve. This is the maximum running slope permitted for an accessible ramp under most building codes, including the Americans with Disabilities Act Standards for Accessible Design and the corresponding provisions in Canadian codes. The value is not arbitrary. It approximates the point at which a person self propelling a manual wheelchair ceases to be able to make sustained progress on an incline, and at which descent becomes a problem of braking rather than of rolling.
Classification against this threshold therefore does not introduce a new standard. It applies an existing regulatory threshold to terrain that was never surveyed against it.
A second band, from 5 to 8.33 percent, identifies slopes that are perceptible and tiring without being categorically excluding. These two bands form the classification used throughout.
The population affected is broader than is often assumed. Wheelchair users are the clearest case, but sustained gradient is also a material constraint for people with cardiac and respiratory conditions, people using walking aids, people with joint replacements, those pushing wheeled luggage or a pram, and cyclists. For some of these groups a gradient is an inconvenience. For others it is an impassable barrier, and a five hundred metre detour on fairly level ground is preferable to a fifty metre climb.
Contour lines answer a different question, and answer it best in open country
Gradient is not a quantity cartography has neglected. It has been represented on topographic mapping for roughly two centuries, and the Ordnance Survey mapping of Great Britain is among the most refined examples: contour lines joining points of equal elevation, drawn at a fixed vertical interval, supplemented by spot heights at summits and other significant points. The interval is 10 metres on the 1:50,000 Landranger series, and either 5 or 10 metres on the 1:25,000 Explorer series depending on how pronounced the relief is.
Contours are a considered and well developed notation, and they are not inaccessible. Elevation values are printed periodically along the lines themselves, and index contours are emphasised, so a reader encountering a line anywhere along its length can establish its height without tracing it to a margin. That repetition is the same device used for road names on a map: state the value often enough that the reader finds one near wherever they happen to be looking. The elevation is therefore available locally, including under magnification.
The difficulty is not that contours withhold information. It is that the information they provide is a different quantity from the one required here, and that the notation is expensive in exactly the places this map is dense.
Contours answer "what elevation is here", not "how steep is this street"
Gradient is not stated by a contour; it is inferred from the spacing between adjacent lines, measured along the intended direction of travel. Closely spaced contours indicate steep ground and widely spaced contours indicate gentle ground. Obtaining the gradient of a particular street therefore requires identifying which contours the street crosses, judging the distance between them along the line of the street, and relating that to the vertical interval. The reader performs the differentiation, and performs it separately for every route considered.
The notation suits open country and struggles with urban content
In upland and rural mapping, where the competing detail is sparse, contours read well and carry a great deal at negligible cost. In a dense urban extract the same lines compete with streets, buildings, boundaries and a high density of labels, and the result is hard to read on paper before any question of digital rendering arises. The areas where gradient most often decides whether a journey is possible are precisely the built up areas where the notation performs worst.
Non visual rendering is possible but laborious
A labelled contour can be announced, and its elevation is a real and useful value. Reconstructing the gradient of a particular street from such announcements, however, requires accumulating several of them, retaining their spatial arrangement, and performing the same differentiation a sighted reader performs by eye. The information is present; the work required to convert it into the wanted answer is substantial.
An alternative approach
The approach taken here changes the quantity rather than the rendering. Instead of representing the terrain and requiring gradient to be inferred from it, the derived gradient is attached to the way itself, as an attribute of that road or path. A street does not sit within a field of contours from which its steepness may be deduced; it carries its own sustained gradient directly.
The consequences follow from that. The value is announced with the feature, so it arrives when the way is encountered rather than being assembled from surrounding marks. It is filterable, so steep ways can be isolated or excluded as a category. It is queryable in language. It travels with the feature under magnification. And it adds no additional lines to an urban map that is already carrying a great deal.
The trade is real and should be stated plainly. Contours describe the entire surface, including ground carrying no route at all, and they support questions this approach cannot answer: the shape of a hillside, the depth of a valley, the lie of open land. Attaching gradients to ways describes only the network. For a map whose purpose is to establish whether a particular journey is feasible, the network is the part that must be legible.
Surveyed gradient data is scarce, and the scarcity is structural
OpenStreetMap, which provides publicly available street map data for constructing maps, has an incline tag capable of recording gradient as a percentage, a ratio, or a direction of slope. In practice it is applied to a very small proportion of the ways for which it would be relevant, with coverage concentrated in a few well mapped urban areas and on hiking routes.
This scarcity is structural rather than a deficiency of the mapping community. Gradient is not directly observable in the way that a bollard, a dropped kerb or a set of steps is observable. Measuring it reliably on foot requires an instrument, or a GPS trace with vertical accuracy that consumer receivers do not provide. Surveyed coverage at national scale is therefore unlikely to arrive within any useful period.
Two options follow: await surveying that may never occur, or derive the quantity from an independent source. This work takes the second option.
A digital elevation model is a raster of heights
A digital elevation model, conventionally abbreviated to DEM, is a raster in which each cell holds a height above a vertical datum rather than a colour value. The resolution of the model is the ground distance represented by one cell. A one metre model holds a height for each square metre of ground; a thirty metre model holds a single height averaged across a thirty by thirty metre area, approximately the footprint of a large detached house.
Heights are captured by several methods. Airborne lidar measures the return time of a laser pulse directed at the ground from an aircraft, and underlies most high resolution national datasets. Photogrammetry derives height from the parallax between overlapping aerial or satellite images. Radar interferometry, which underlies most global datasets, compares the phase of radar returns acquired from orbit.
Gradient derivation from such a model is arithmetically trivial. Given two points along a way, the height at each is sampled, the difference in height is divided by the distance travelled between them, and the quotient is expressed as a percentage.
The arithmetic is not where the difficulty lies. The difficulty lies in the assumptions embedded in the source data and in the sampling.
Terrain models and surface models are not interchangeable
Elevation models are published in two forms, and conflating them produces results that are confidently incorrect.
A digital surface model, or DSM, records the height of the first surface encountered by the sensor. This includes tree canopy, roof lines, and any transient object present at capture.
A digital terrain model, or DTM, records the height of the ground itself, with vegetation and structures computationally removed.
For gradient derivation the distinction is decisive. A footway running beneath mature trees, sampled against a surface model, inherits the height of the canopy. The derived profile shows a climb and descent of many metres across a level route, and the resulting classification is not merely inaccurate but actively misleading. A street sampled against a surface model may inherit the height of the buildings flanking it.
The constraint adopted here is therefore absolute: terrain models only, never surface models. A path beneath trees must not inherit the height of the trees, and a street must not inherit the height of the buildings along it.
This single constraint substantially complicates source selection, because global bare earth coverage is uneven in resolution, inconsistent in licensing, and published in several incompatible architectures.
No single provider offers global coverage, so sources form a per country ladder
Coverage was assembled as a per country ladder, ordered by resolution, with fallback as coverage is exhausted.
Canada. The Natural Resources Canada elevation datacube: the high resolution digital elevation model at one metre where available, at two metres where not, and the medium resolution thirty metre model elsewhere. High resolution coverage is real but discontinuous, concentrated on populated areas and infrastructure corridors, which is precisely the condition a ladder exists to handle.
United States. The 3D Elevation Program (3DEP): the lidar derived terrain model at one to two metres where flown, then the seamless one third arc second product at approximately ten metres, then one arc second at approximately thirty metres.
Switzerland. swissALTI3D at two metres, published openly by swisstopo.
England. The Environment Agency lidar composite terrain model at one metre.
Ireland. No dedicated source, and the reason is instructive. Ireland has no single national high resolution terrain model published as a continuous open dataset. What exists is lidar captured by individual projects and programmes, covering particular catchments, coastlines, cities and infrastructure corridors, in differing formats and under differing terms. Assembling those into continuous national coverage would be a project in its own right, and the result would still contain gaps. For a map that must answer consistently everywhere rather than excellently in some places and not at all in others, partial high resolution coverage is worth less than complete coarse coverage. Ireland therefore resolves to the global fallback.
Global fallback. FABDEM, a bare earth model at approximately thirty metres derived from the Copernicus radar DEM with buildings and forest removed. It serves as a floor so that no region silently receives no data at all.
The Irish case is the clearest illustration of a general principle. The constraint on this work was rarely the best data available in a given place. It was the worst data available across the whole of a place, because a map that answers well in one district and not at all in the next has not answered.
Provider architectures differ as much as their resolutions
The five sources are not merely of differing resolution; they are of differing shape, and each difference invalidates an assumption that held for the others.
Canada publishes large mosaics. A regional bounding box matches a small number of rasters, and opening all matches at the outset is tractable.
Switzerland publishes one kilometre tiles, so a bounding box covering Zurich matches over two hundred. The United States lidar product is more extreme, with a single state matching several thousand. Opening every match at the outset would require thousands of concurrent HTTP handles for a task that will access a few dozen, so sources must be opened lazily, only when a sample point falls within one.
Tile catalogues are paginated, and this is not a triviality. An implementation that requests a fixed page and ignores the continuation link behaves correctly against Canadian mosaics, where the match count never exceeds seventeen, and silently produces partial coverage everywhere else. The failure presents no error and no warning; elevation data is simply absent in locations that no test would think to examine. Silent partial success is the most dangerous failure mode available to a data pipeline, because it is indistinguishable from success.
England is not a file based source at all. No cloud optimised mirror of the Environment Agency composite exists. Access is by live web coverage service, answering requests for windows of the raster. A source in this architecture is therefore defined not as a file but as anything capable of answering the question of elevation at a given set of coordinates.
Retrieval is windowed throughout. Except for England, reads are HTTP range requests against cloud optimised GeoTIFFs, so a request for a set of sample points retrieves only the blocks containing them. No raster is downloaded in full.
Accuracy and resolution are distinct properties, and only resolution proved limiting
The global fallback was validated against high resolution data rather than assumed fit for purpose. FABDEM was sampled against the England one metre lidar composite at identical coordinates. Primrose Hill in London returned 50.9 metres against 51.2, while Hampstead Heath returned 90.9 against 91.1. Agreement is therefore within approximately 0.3 metres on open terrain, for a thirty metre radar derived global product measured against airborne lidar.
This establishes that the global product is not systematically biased. It does not establish sufficiency, because accuracy and resolution are separate properties.
The limitation is resolution. At approximately thirty metre posts, sampled at a fifteen metre spacing, consecutive sample points frequently fall within the same cell and return an identical height. The model consequently reports terrain at the scale of hills and averages short steep features out of existence. A twenty metre section at twelve percent, which is precisely the feature most relevant to a wheelchair user, may be absent entirely from the derived profile.
The general conclusion is that coarse global coverage describes terrain, while lidar derived coverage describes paths. The same trade is already accepted across the majority of Canada, where the thirty metre model covers everything the one and two metre products do not.
Deriving gradient requires constraints beyond arithmetic
Sampling at fixed intervals and reporting the steepest pair produces unusable output. Four constraints govern the derivation.
Gradient must be sustained
A value is computed only over a run of at least ten metres. Disagreement between two adjacent samples is noise rather than topography.
Only significant gradients are asserted
Ways whose steepest sustained run falls below five percent receive no incline value. Recording a gentle gradient on every level footway would populate the terrain classification with noise presented as information. For level ground, silence is the correct output.
The steepest sustained section governs
A street that is level for three hundred metres and then rises at eleven percent for forty is classified as steep, because the forty metre section is the constraint. Do not average out the gradient.
Surveyed values take precedence absolutely
Where OpenStreetMap carries a hand tagged incline, it is used and no derived value is computed. An observer present at the location supersedes a raster. Derived values additionally record their own provenance, so that a consumer can always distinguish a surveyed measurement from an inferred one.
Bridges and tunnels must be excluded rather than estimated
A terrain model represents bare earth and contains no representation of built structure. A way crossing a bridge is not sampled against the deck carrying it; it is sampled against the ground beneath, which may be the floor of a rail cutting or a river valley. The derived profile descends steeply and recovers, and the classification produced is severe and entirely spurious.
The effect was observed in production. A cycleway crossing a rail bridge in Kitchener, Ontario returned a derived gradient of approximately forty percent. The gradient of a structure cannot be recovered from a model of the terrain beneath it, so ways tagged as bridges or tunnels are excluded from derivation rather than estimated.
A second filter addresses the same class of error where it is not tagged. Any individual sample pair yielding above thirty five percent on a walkable way is treated as an artefact rather than a measurement, the usual causes being an unsplit bridge approach, the edge of a retaining wall, or a void in the lidar. The pair is discarded and the way retains its next highest sustained value, rather than being classified on the basis of a single defective cell.
This does mean that I may report in error on remote steep mountain paths, a detail not yet resolved in my maps.
Bounding boxes cannot separate adjacent territories
Coverage extents are conventionally described by bounding boxes, which are rectangles in latitude and longitude. This is adequate where territories are compact and separated, and it fails wherever they interleave.
The English source is a case in point. Its box extends west to longitude −6.5, which is not an arbitrary margin. England includes the Isles of Scilly, whose westernmost point, the Crim Rocks, lies at approximately −6.45, so any rectangle holding the whole of England must reach at least that far west. Dublin city centre lies at approximately −6.27. At that latitude a degree of longitude is about 66 kilometres, which places Dublin roughly 12 kilometres east of the meridian England's own territory obliges the box to reach, and about 16 kilometres inside the box as configured.
A bounding box drawn tightly around England therefore contains the capital city of another country (and also the whole of Wales and a small part of Scotland). The box is not careless. It is correct, and it still swallows Dublin.
The general case is worse still. The United Kingdom includes Northern Ireland, which is on the island of Ireland, so any bounding box covering the United Kingdom necessarily covers most of the Republic of Ireland as well. Here the overlap is not an artefact of using rectangles at all. The two states genuinely share an island, and no bounding box can separate a state from a neighbour it is interleaved with. A rectangle merely makes an unavoidable problem larger.
The lesson generalises well beyond these two countries. A bounding box expresses a claim about where data exists, and political geography is under no obligation to be rectangular, contiguous, or conveniently arranged.
This would be immaterial if querying the English service at an Irish coordinate returned an explicit absence of data. It does not. Outside its coverage the Environment Agency service returns a raster of zeroes, which is a syntactically valid elevation corresponding to sea level. Distinguishing data from absence therefore requires retrieving and inspecting the response.
At full resolution such an inspection costs approximately 9.4 megabytes per square kilometre, and every sample point in Ireland incurred it.
The effect was measured during the national reindex. Ireland was processed in eight vertical slices, which divide precisely at the eastern edge of the English bounding box at longitude −6.5:
| Slice | Longitude range | Relative to box | Throughput |
|---|---|---|---|
| 00 | −10.700 to −10.025 | outside | 8,731 documents per minute |
| 05 | −7.325 to −6.650 | outside | 11,165 documents per minute |
| 07 | −5.975 to −5.300 | inside | 543 documents per minute |
| 06 | −6.650 to −5.975 | inside | 21 hours elapsed, no output |
Slice 06 contains Dublin. The boundary corresponds to no physical feature.
Downsampled probing reduces the cost of the coverage question
The service honours a scale factor parameter. Requesting the full extent downsampled to approximately forty eight pixels returns 9.6 kilobytes rather than 9.4 megabytes, and yields a bit identical verdict on the presence or absence of data.
Coverage detection was accordingly restructured into three stages. A ten kilometre block probe eliminates one hundred square kilometres per request, reducing Ireland from approximately fourteen thousand full resolution windows to approximately one hundred and forty probes. A one kilometre cell probe follows, since a block may be partially covered at a coastline or a border. Full resolution retrieval occurs only once a cell is known to contain data.
The probe downsamples the entire extent rather than sampling its centre. A coastal cell that is largely sea nonetheless contains land, and centre sampling would discard it. Validation against known landmarks confirmed no change in returned values: the mouth of the Tyne resolves to 1.8 metres, Dublin Castle to 12.1, Cave Hill to 301.9, and Primrose Hill to 51.2.
Sampling time for Dublin fell to 5.4 seconds and for Belfast to 3.3 seconds. England remains slow, correctly, because it requires full resolution retrieval.
Bandwidth is a design constraint on shared and metered connections
The derivation was executed over a wireless mobile connection of approximately 2.5 megabits per second, metered.
Elevation blocks were initially read with eight concurrent workers, and the region builder processes two slices concurrently, giving sixteen simultaneous range requests against national elevation services. Throughput improved by approximately six times and consumed roughly half the available bandwidth continuously.
The consequence was that packet loss to the project's own web server rose from zero to ten percent, rendering the live site unresponsive for minutes at a time while the server itself remained idle. Small requests completed and large requests failed, which is the expected behaviour of TCP congestion control under sustained loss.
The default was accordingly reduced to two workers. This is not a throughput setting but a contention setting: the process shares a scarce metered link with interactive use, and a background task that renders foreground use impossible has not succeeded.
The observation is included because infrastructure work is customarily documented as though bandwidth were unconstrained and the machine unshared. Neither condition holds for a substantial proportion of practitioners, and designing to the constraint produced a more defensible result than assuming it away.
Queries the index now supports
The production index contains 93,761,159 features. Of these, 1,113,093 ways carry a derived gradient classification: 784,827 above 8.33 percent, and 328,266 within the moderate band of 5 to 8.33 percent.
Queries of a form previously unsupported are now answerable in natural language. The gradient of a named street may be requested directly. Steep paths within a given park, or moderate inclines near a given station, may be enumerated. The gradient profile of a historic quarter may be characterised, which is of particular interest where an escarpment separates districts and the connecting streets consist largely of sustained climbs.
No part of this required a surveyor to record a single slope.
Limitations of the derived data
Derived data is trustworthy in proportion to the clarity with which its limits are stated.
Short steep sections are absent from coarse coverage
Where only the thirty metre global model is available, a twenty metre pinch may be averaged away completely. Terrain is reported; short ramps are not.
Cross slope is not represented
Camber, the lateral tilt of a footway, is a significant accessibility barrier and frequently a more severe one than longitudinal gradient, since it steers a wheelchair towards the carriageway. It is not resolvable at these resolutions.
Kerbs, steps and surface remain separate problems
A gradient computed across a flight of steps is not a meaningful quantity. These attributes derive from tags, and where tags are absent the data is silent.
A gradient is not a route
Establishing that a street is steep does not establish the existence of a level alternative, which is a distinct problem.
Derived values are estimates and are labelled as such
Every computed gradient records that its provenance is an elevation model rather than an observer, because the distinction is material to any downstream decision.
Conclusion
The objective was not to substitute for survey. It was to prevent the absence of survey from entailing the absence of an answer. For rather more than a million ways, it no longer does.
Failures in public policy objectives are also highlighted by this work. If knowing the gradient of roads and paths is necessary for accessibility and safety, and it is, how can any government commitment to be fully accessible by a stated date be met if there is no high resolution DEM for the entire jurisdiction of that government? Ontario, Canada targeted being fully accessible by 1 January 2025 (and missed on many metrics) but never had a policy to ensure disabled people knew which roads and paths were usable by them. I don't remember reading anything in the Accessible Canada Act for that either. Remember that the resolution of the DEM directly impacts whether short steep gradients are caught.
If you wish to try the new gradient feature, please visit and explore the Knowledge Map.
The map covers the whole of Canada, Ireland, London (England), Zurich (Switzerland) and most of the eastern seaboard of the USA down to and including North Carolina. It is designed to pick up your location, but even outside those regions you can explicitly query a location within them.